A guidebook to map and assess opportunities for solar, wind, and biomass energy development
Purpose and Objectives
The purpose of this section is to provide concepts, techniques, and tools to map land based RE resources, namely wind, solar, and cellulosic biomass (corn stover, straw, and woody materials). The maps produced by these workflows are not meant to be used definitively. They are meant to produce maps that help to inform public dialogue and policy making, while providing an initial assessment through which to target investment decisions. In other words, they are planning tools, not tools for direct site determination. In the context of community energy planning, these maps can be used for the following:
Identify opportunities to develop RE resources at scale.
Anticipate where RE systems are likely to be proposed / implemented throughout the municipality under prevailing technological and policy conditions.
Understand how municipal-level environmental protections and zoning policies influence access to resources, and open/close opportunities for large-scale RE development.
Provide information necessary for land-use policy development, community and stakeholder engagement, and collaborative implementation planning.
Background and Significance
Renewable energy systems introduce landscape impacts and land-use tradeoffs that need to be identified and managed – think about solar panels covering what used to be an active pasture; wind turbines altering a natural view and introducing a new risk to local wildlife; or agricultural fields growing crops for energy rather than food. RE infrastructure is also highly visible and covers wide areas; energy generation is no longer ‘out of sight, out of mind’ like coal or nuclear. In other words, the energy transition will drive a profound landscape transformation. Energy mapping allows us to understand where those transformations may manifest throughout the community under various policy and technology scenarios. How much land, and what kind of land, will be needed to power a sustainable energy future? Can we allocate significant tracts of land to RE production and still ensure that our local landscapes continue to provide food, habitat, spaces for recreation, and other land-based economies and ecosystem services? How are these land-use tradeoffs perceived by the public? How will changing technologies mitigate or exacerbate these issues? And how should our existing land-use planning systems evolve to help manage these trade-offs? These are just some of the questions that our guidebook will help answer.
At the same time, opportunities for RE development are controlled by local land-use and environmental management policies. A short list includes policies related to groundwater protection; protection of rural and natural areas; and setback distances from natural areas or residential areas for large infrastructure large wind turbines. Energy mapping can help to understand how prevailing policies and regulations at the local level are opening or closing opportunities for RE development in the region. Decisions can be made about whether those policies and regulations should be amended to achieve community objectives. In other words, the workflows described in this section will provide local governments and communities with the critical information they need to prepare for this integrated energy-land transition.
The content in this section has been written for a reader with some technical background in geographic information systems (GIS). We have tried, to the best of our ability, to be clear in our description of the workflow, without providing extraneous detail. We decided to leave out detailed step-by-step instructions, given the rapid pace of change in the software and data that are used for this type of work. Instead, we describe our approach at a conceptual level, but with enough detail such that the processing and analytical steps will be intuitive for someone with a GIS background. The writing is consistent with a tutorial that may be delivered for an upper year undergraduate GIS student. From project initiation to reporting, a small GIS team should be able to complete the spatial analysis, mapping, and reporting within 1-2 months per resource, using the guidance provided below.

What about rooftop solar mapping?
Rooftop solar energy is critical to decarbonization and local economic development and should be supported by municipalities. Our team has capacity to map and analyze rooftop solar potential at the community scale (see here) and Google is developing new homeowner-facing tools in a partnership with MyHEAT. The tools we are sharing here, however, focus on land-based energy systems in recognition of the fact that rooftop solar is necessary but by itself insufficient to achieve a sustainable energy future. Detailed energy assessments at the city-scale have shown that rooftop solar energy potential is about half of total electricity use across a typical city in North America; not accounting for the electrification of transport and heating. In other words, renewable energy generation will need to sprawl beyond our rooftops and existing infrastructure if we hope to achieve ambitious goals around RE generation while decarbonizing heating and transport systems.
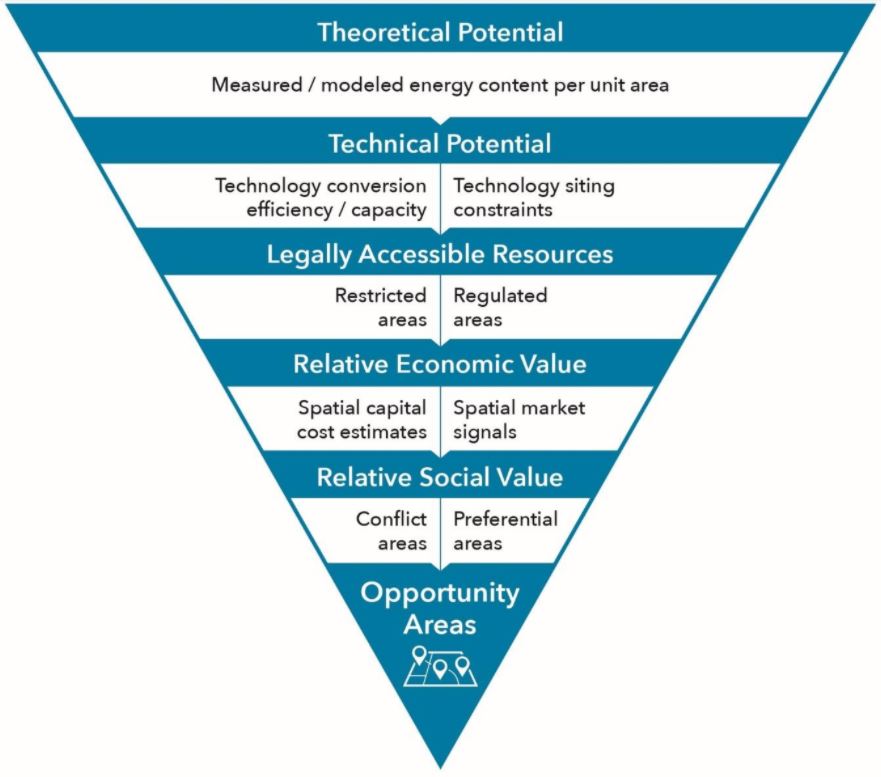
Renewable Energy Resource Classification System

The key features of the framework are as follows:
- Uses a nomenclature that can be standardized across RE options to identify, organize and analyze the factors that distinguish theoretical RE potential from what is realizable in an area
- Maps constraints from local-level land-use and environmental regulations, in addition to federal and provincial regulations, when accounting for regulatory constraints on site access
- Enables policy-scenario analysis, for example by showing how access to RE would change under different regulatory settings (e.g., wider set back distances).
- Estimates spatial capital costs of development. Does not model technical-economic performance of a technology in-place but provides key spatial information that can be inputted into a technical-economic model.
- Uses participatory mapping to clarify and separate normative (i.e., political but non-regulated) preferences for RE development.
- Does not produce a definitive map that can be used for siting, but rather an illustrative map that provides critical information for public-engagement, land-use planning, and implementation / development planning.
Table 1: Description of categories included in the resource classification system visualized in Figure 1.
| Category | Definition | |
| Theoretical Potential | Measured or modeled energy potential across a geographic area. These maps depict physical expressions of energy flows across Earth’s surface. Also referred to as physical limit or gross potential. | |
|
Technically Recoverable Resources
|
Theoretical resources are mapped as ‘technically recoverable’ or ‘not technically recoverable’. These maps depict theoretical resources that can be converted into useful energy by prevailing technologies (technology conversion efficiency limit), at sites that can be accessed using reasonable engineering solutions (technology siting constraints). Both are dependent on interactions between the technology and site characteristics.
|
Technology conversion efficiency / capacity factor limit (a.k.a. ‘production ceiling’): estimated net energy recovered based on system efficiencies and system capacity factors, typically assuming conversion technologies at or beyond the research and development stage of innovation chain. This limit will increase through technical innovation. |
| Technology siting constraints (a.k.a. ‘carrying capacity’): includes site-specific barriers to infrastructural development and to system engineering and operation. In the case of biomass, residue coefficients are applied to account for the organic content that needs to be returned to the landscape to maintain soil health. | ||
|
Legally Accessible Resources
|
Technically recoverable resources that are accessible without violating existing regulations related to land-use and infrastructure siting. Prohibited areas are removed from consideration. Regulated areas are mapped along a gradient of ‘regulatory risk’ from high to low based on the discretionary powers held by the government to approve or decline a project.
|
Prohibited areas include those areas and features that are protected from development by inhibitive regulations. Often, these areas are protected from all infrastructure development. In some cases, they are protected from specific kinds of renewable energy development (e.g., solar farms not permitted on “prime agricultural land”) |
| Regulated areas represent permissive regulations. The level of permissiveness relative to a specific technology is interpreted so that we can distinguish the likelihood of project approval | ||
|
Relative Economic Value
|
Legally accessible resources are mapped according to relative economic potential, based on relatively low capital costs and relatively high market readiness. Map outputs created for this category become an input into community / stakeholder engagement exercises. Note: this does not map site-level economic viability – only potential. These outputs would provide spatial information necessary to determine viability based on a more detailed site-level techno-economic analysis.
|
Capital costs: mapped on a gradient from relatively lower to relatively higher capital costs of development. These costs are a function of site access, site preparation, and connection to distribution systems. These costs vary as a function of total system costs depending on the resource in question. |
| Market readiness: where relevant, variations in market price are mapped to indicate those resources that are available in ‘high cost’ zones and therefore more likely to be market ready. | ||
|
Relative Social Value
|
Sites that are likely to be developed with least social conflict and / or are perceived as opportunity areas by multiple decision-makers. Mapped primarily through participatory mapping with the public, stakeholder groups, and organizations that have capacity to implement projects
|
Least social conflict: mapped on a gradient from more to less acceptable. Participants indicate areas that they might find ‘acceptable’, ‘not acceptable’, or ‘conditional’ for the development of a particular resource. Those are compiled into a single map layer. |
| Opportunity areas: identify locations at which shared benefits are accrued across individuals and organizations that have decision-making authority in the RE development process | ||
Mapping Theoretical RE Resource Potential
It is important to visualize resource data in ways that might be meaningful to a wider audience. Here are strategies we use in our work:
- Solar resources are visualized relative to California and Germany. Both jurisdictions have seen significant solar energy development in recent years, even though Germany’s solar potential is much lower than California’s. This helps to substantiate the point that the strength of the resource itself is not by itself sufficient to explain opportunities for solar energy development.
- Wind resources are classified into standardized categories from the International Electrotechnical Commission (IEC); these classifications are used by developers to make technology selection decisions.
- Biomass resources are derived from agriculture and forest land-covers. Biomass can be transported approximately 150 km before the economic and energetic costs exceed the benefits and as such, we map agriculture and forest land cover types within 150 km of the region of interest.
Of course, the presence of the resource is a necessary but by itself insufficient condition for RE development. There are a host of technical, legal, economic, and social parameters that shape where and under what conditions a resource might be accessed. These parameters depend on resource option and technology type. As such, the remainder of the toolkit provides guidance on a resource-by-resource basis at each level of analysis.


